Posts Tagged Deaths

COVID in Missouri

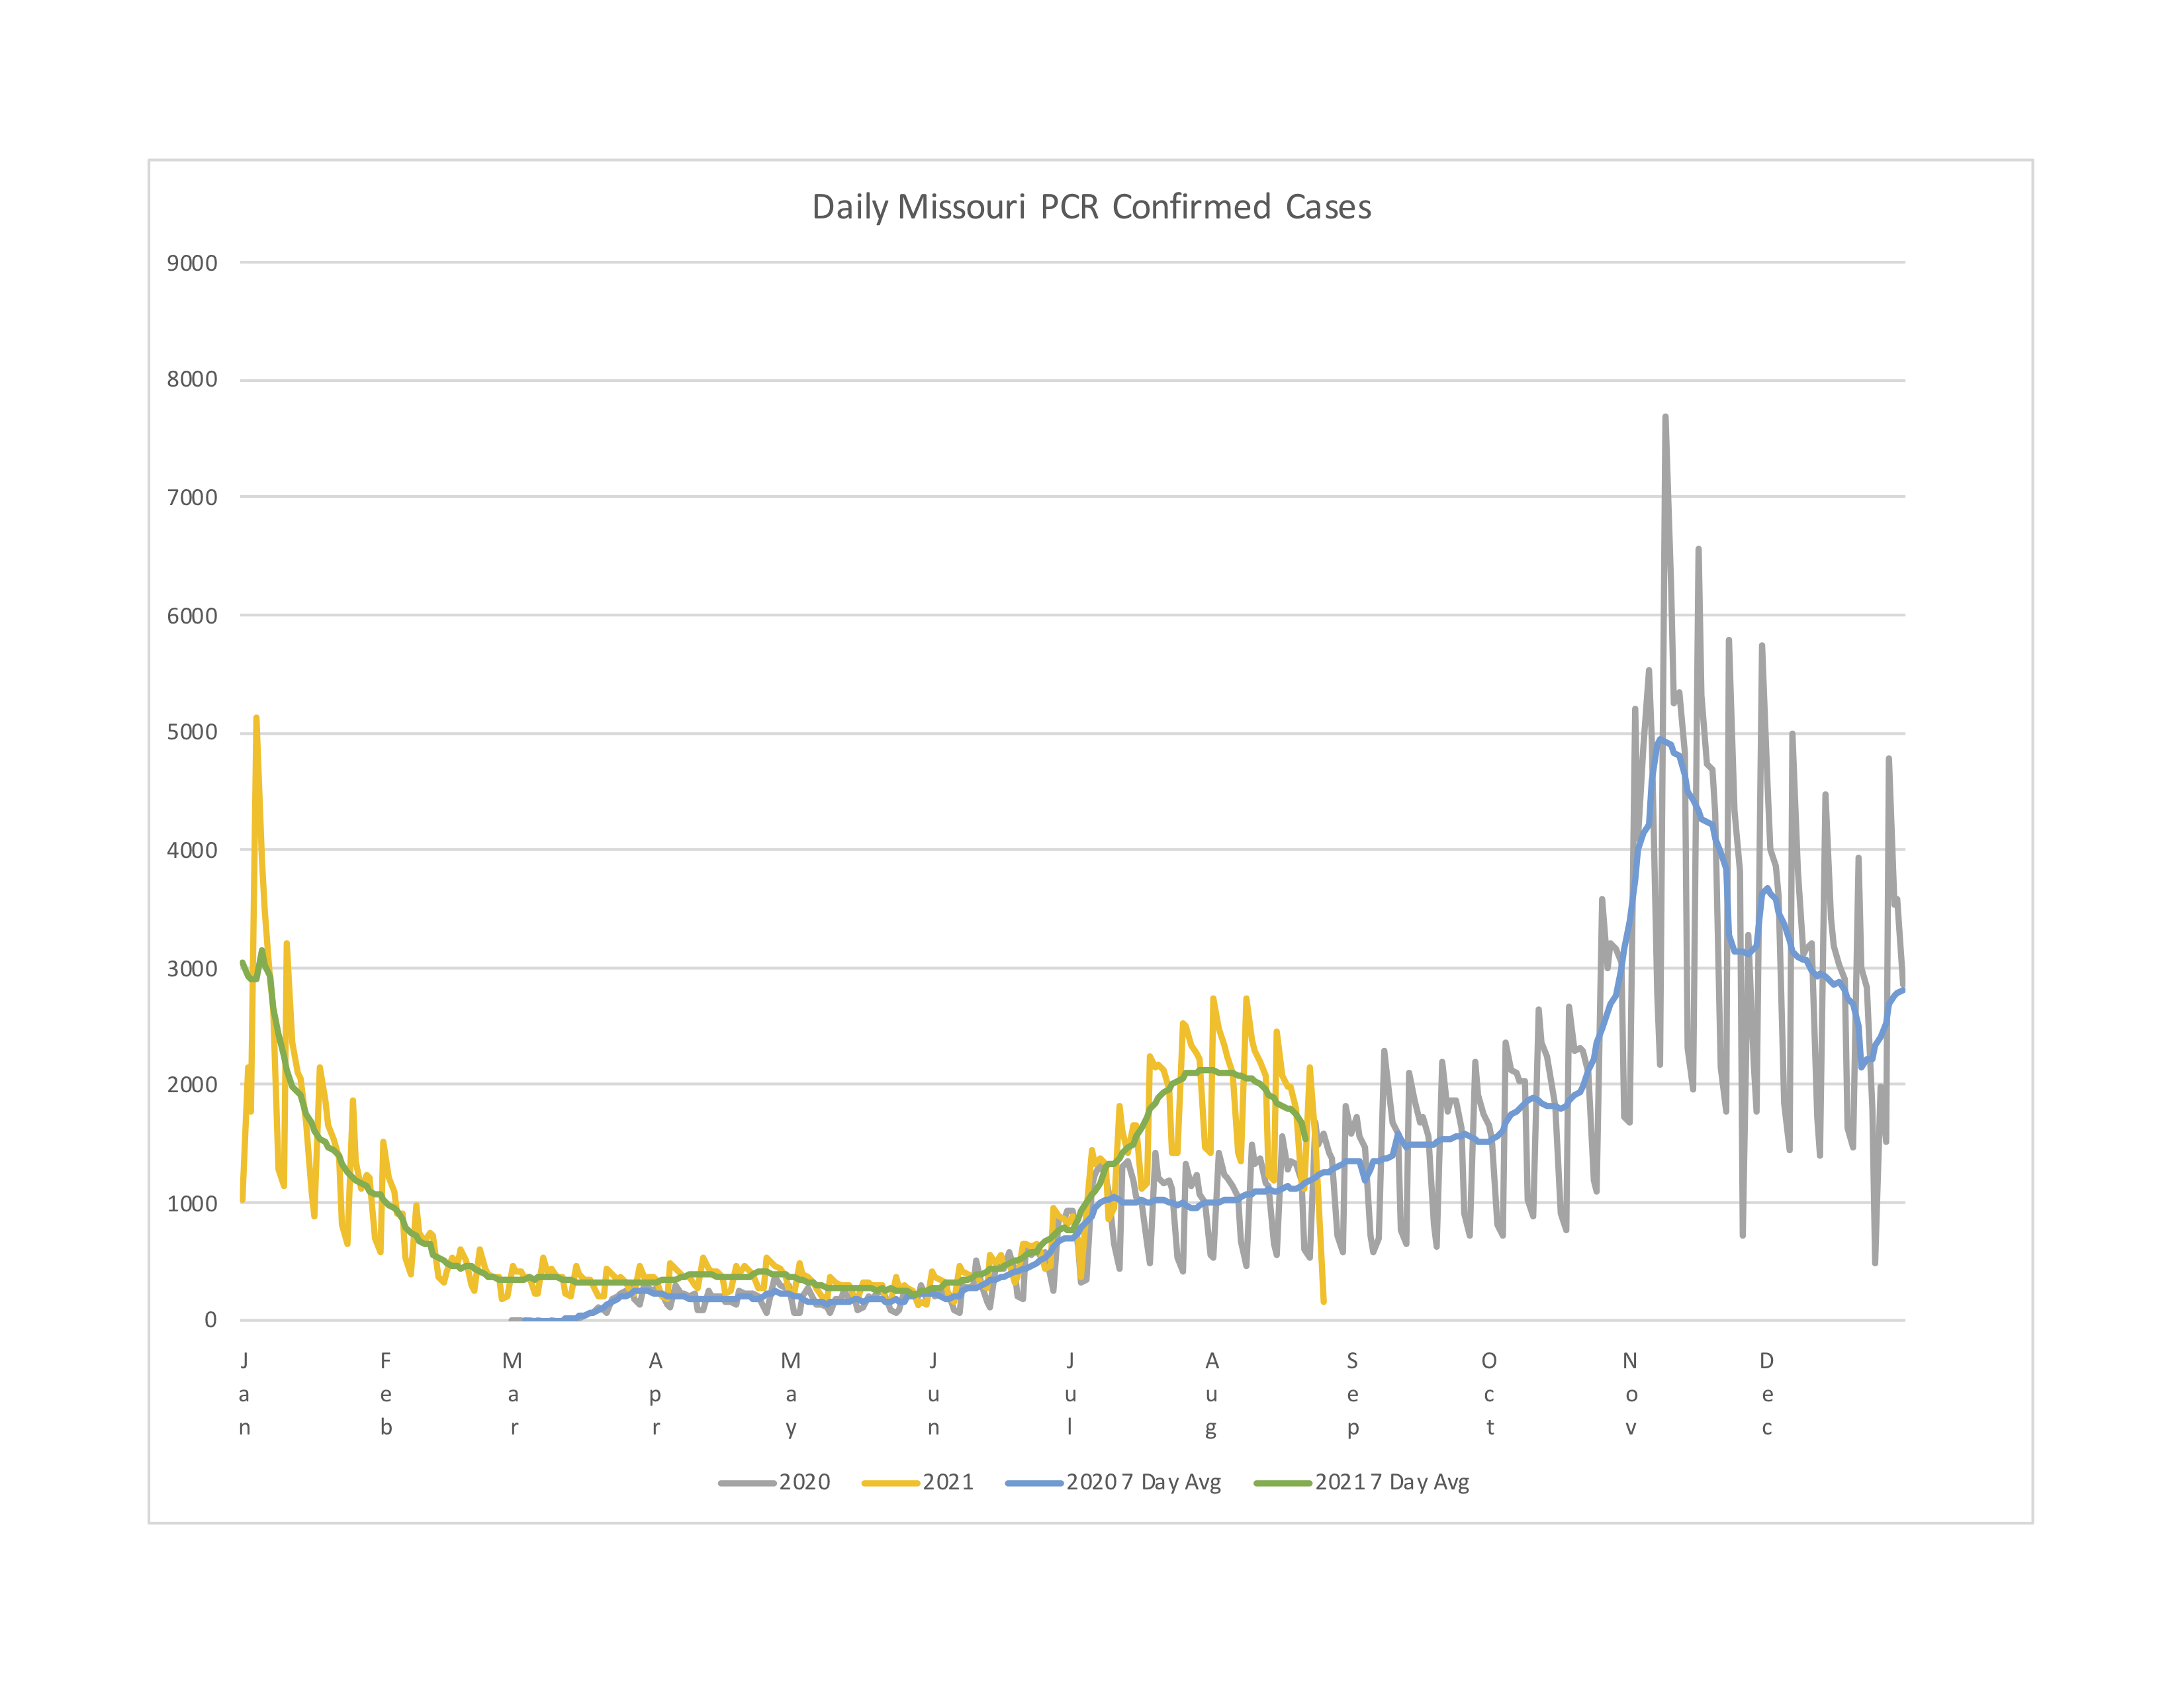
I plotted COVID cases and deaths here in Missouri with year on top of year which I think is important with a seasonal virus. While there were divergences between cases and deaths in 2020, 2021 they look pretty lock step taking into account the slight delay from cases to deaths.

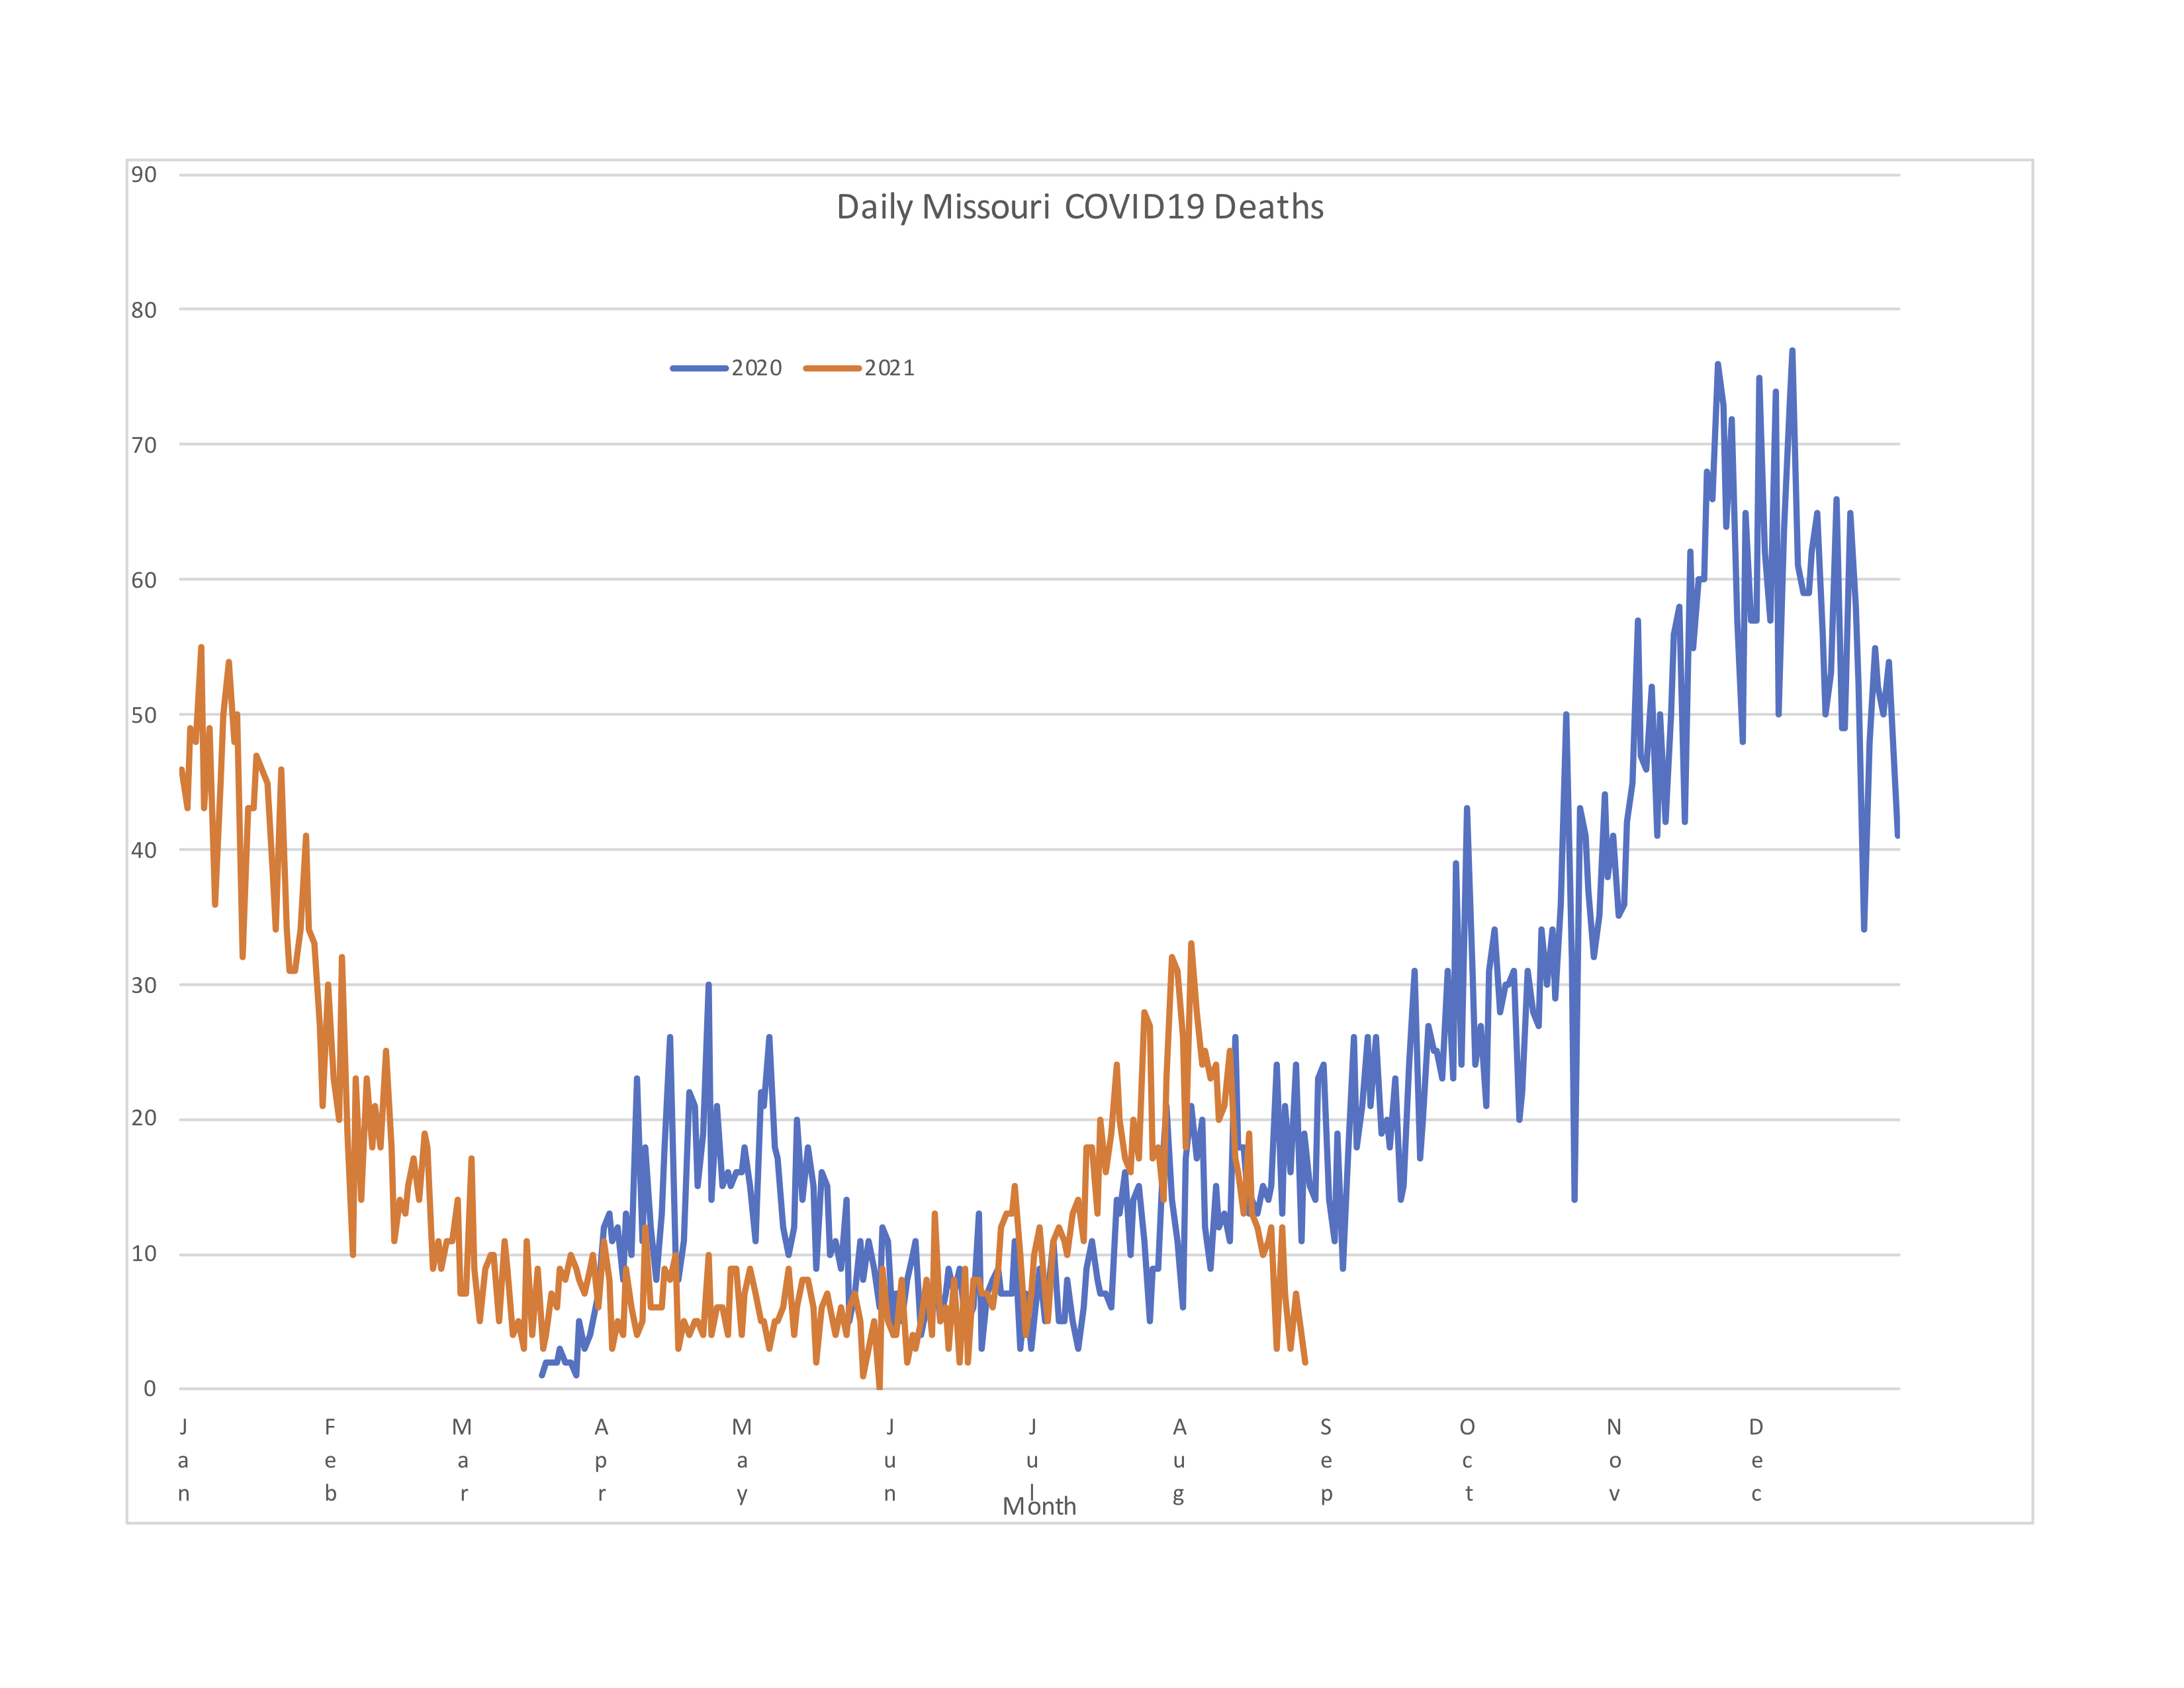
My biggest takeaway looking at the death chart is that while happy days may not be here again, happier days are – as long as the drop isn’t due to delays in death reporting. The fact that cases and deaths have been dropping essentially for the month of August while last year they kept rising is a good sign, a sign that between vaccinations and infections the virus is running out of susceptible people to infect. I would be concerned that if the cases chart is a more accurate indication of seasonality, we might still have a fourth wave coming in November (again).

Another take away is since we’ve been through three waves in Missouri, we have achieved “herd immunity” three times already, IOW R (reproduction number) has been above 1 three times and below 1 three times (don’t even get me started on R naught for a seasonal virus). I think we are headed to COVID becoming an endemic minor childhood disease but we still have some rough times ahead to get there in the year to come. If you have not gotten infected or vaccinated yet, your choice is either to go through an infection vaccinated or unvaccinated, and I’m going to suggest vaccinated is the better way to go. COVID zero is a pipe dream, COVID as just another viral infection amongst others is the reality.

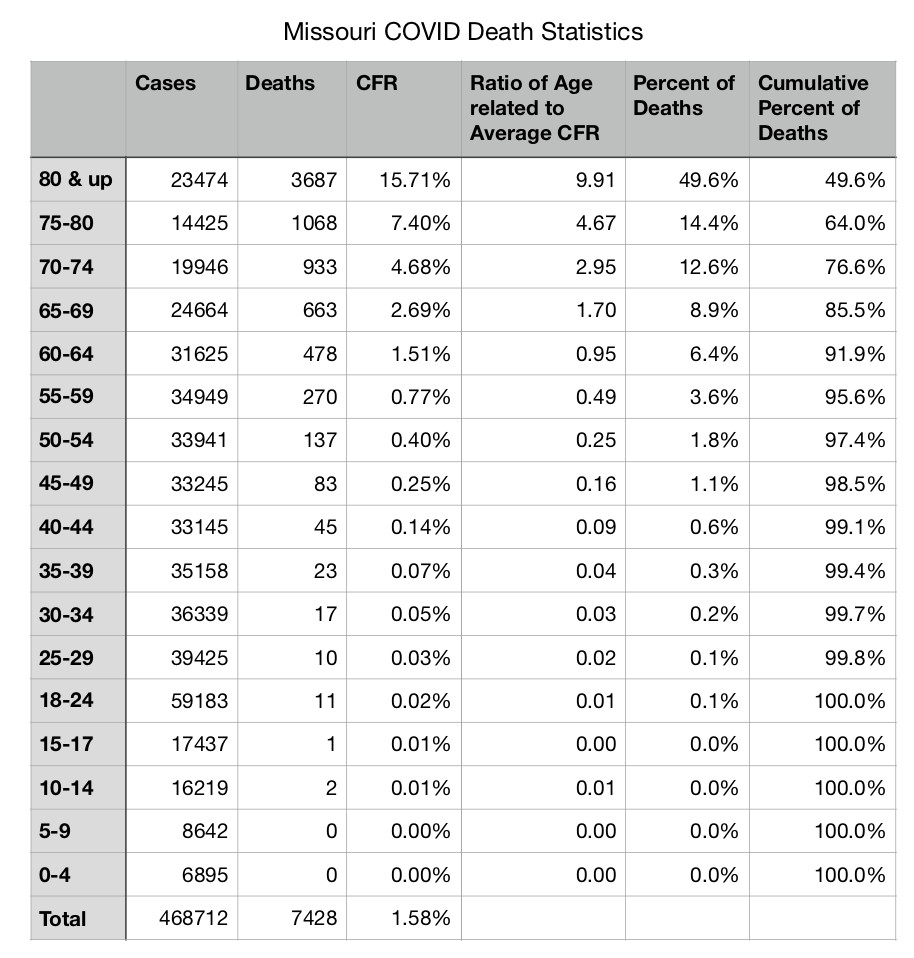
Clearly Delta is more infectious since the late summer surge was greater in 2021 than 2020 despite the fewer susceptible people more people were infected and died. The media keep saying the hospitals and ICUs are as full right now as during the peak last Nov and Dec last year, yet the death rate of the most recent peak is roughly a third what is was then so I have to wonder what is really going on. Are we hospitalizing more for treatment, or are we doing that much better keeping hospitalizations advancing to deaths? Or is the media just being negative and sensationalist? The answer is left as an excercise for the reader.

Tags:

Youth COVID Death Statistics

More stats, namely deaths of 5-17 year olds per year, data from a couple of days ago:

The good news is that car accident deaths have been declining for years. The bad news is that schools are still mostly closed for in school learning, and yet we don’t give a second thought to our children dying in car accidents (or drowning in buckets).

FYI deaths from poisoning (AKA drug overdose) doesn’t pass car accidents until age 23.

Tags:

Missouri COVID Death Statistics

While My Better Half was barreling across multiple states on her epic road trip, I put together a spreadsheet of Missouri COVID death statistics from the state of Missouri’s COVID dashboard which provided the number of cases and deaths by age group which allowed me to calculate the case fatality rate; the ratio of age related to average CFR column (not a percentage!) which is the age related CFR divided by the average CFR in the Total row – so the value of 9.91 for 80+ indicates that people in that age category have 9.91 times the risk of dying on a case basis than the average while at 55-59 you have basically half the risk; and the percentage of deaths by age group plus the cumulative percentage. I have to believe Missouri is representative of the country as a whole since we are kind of in the middle both in location and rural/urban split. Sometimes we just don’t appreciate how age drives outcome for COVID – not shown but based on other data I’ve seen the rate at which people are admitted to the ICU is driven by age, but not as strongly as deaths, and admitted to the hospital is driven by age, but even less strongly than ICU admission.

This is why I keep saying the vaccinations should only focus on older people and those with comorbidities, and any focus on an essential job will wind up killing people and keeping hospitals overburdened. More than 85 percent of deaths occur in people past the age of retirement, so the data and experience make it crystal clear our essential societal functions can thrive in the face of COVID, unlike for example extreme cold or heat or wildfires which have brought the regions of the country that have experienced them recently to their knees. It’s as deadly as putting COVID positive people back in nursing homes to vaccinate anyone younger with no comorbidity before anyone older.

Also, there have only been 3 deaths of people under the age of 18, which is less than flu kills year in and year out of this age group. People in their 20s run a tiny risk, so schools really should be open in person full time with an option for those few that do have comorbidities.

We have to abandon our preconceived notions about disease and just follow the data for the one we are actually confronted with – and COVID is not an equal opportunity killer. When the data tells us the median age of death is 79, we need to listen.

Values for Case and Death from Missouri COVID dashboard early February 2021

Tags:

Let’s Talk About Death, Shall We

I’d like to highlight a huge revision from the CDC (https://www.cdc.gov/coronavir…/…/hcp/planning-scenarios.html) to the USA case fatality ratio for COVID 19 to current estimate of 0.4% overall for symptomatic cases. Not 3.4% which was the WHO’s value from China and what we started the pandemic with. But that number hides just how significantly it changes with age. The value for people under 50 is 0.05 percent, and when you take into account that CDC estimates that 35 percent of cases are asymptomatic, you get a infection fatality rate of 0.0325% for people under 50, and if you factor in the effects of pre-existing conditions and the likelihood that younger people have a higher asymptomatic rate than older people, it’s probably less. If you are under 50 without any COVID preexisting conditions, you’re chance of dying isn’t one in a million but it is getting surprisingly close – heck, if you’re under 25 it may actually be better. 

But let’s compare that to the flu, and we will leave it at the 0.03%. Looking up values for last seasons flu numbers which CDC estimates led to 60,000 deaths in the US (and let me say it’s a very loose estimate- all values from: https://www.cdc.gov/flu/about/burden/2017-2018.htm) for the 18-49 year age bracket we have estimates of 2,803 deaths from 14,428,065 illnesses or 0.02% death rate for that age group, which is 50% higher but sure looks pretty similar especially as they are both estimates. So for the under 50 crowd COVID19 looks like a bad flu. And does anyone remember any lament in the spring of 2018 that the flu season that year had killed more Americans than the Vietnam war?

For the over 65 crowd, you have a 0.86% for the flu in 2017-2018, the number is 1.3% for symptomatic which I’m not going to adjust because at that age I’m not sure how many cases are asymptomatic which again leads to about a 50% higher death rate but at those values doesn’t look too similar. And since the over 65 crowd is estimated to have suffered 51,000 deaths out of the estimated 61,000 that season, you can see how the seniors not only drive the flu numbers but drive the COVID numbers even more. 

Did you know that if you are under 50 your chance of dying from an accident as you go about your daily life is higher than of dying from COVID if you catch it?

If you’re really feeling cheery, dive into the Deaths and Mortality (2017 is the latest) statistics with me (https://www.cdc.gov/nchs/fastats/deaths.htm) where you can see that at 100,000 deaths COVID has passed up flu/pneumonia (55,700 deaths) and diabetes (83,500) – although since diabetes is considered one of those death enhancing preconditions for COVID, which one gets credit if someone dies with both diabetes and COVID – and is closing in on Alzheimers (121,400). Then comes stroke (146,300), chronic lower respiratory disease (160,200 – and same question as diabetes), accidents (169,900) and then the two biggies – cancer (599,100) and heart disease (647,500). I’m hoping COVID doesn’t make it past Alzheimers. When you add it all up, the average death rate for all causes for all Americans in 2018 was 0.87%.

So while on the one hand it’s kind of amazing that COVID can come out of nowhere and become the seventh leading cause of death in roughly 3 months, on the other hand all those others kill people year in and year out without much fanfare from the media or concern on our part.

Tags:

Why Are We Not Adapting to New Data?

All the politicians and bureaucrats who are making the rules we live by these days always invoke science and data as the ultimate arbiter for all the rules.   You would be hard pressed to find a bigger fan of science and data than me, and less of a fan of politicians and bureaucrats.  So now that CDC says transmission is primarily through respiratory droplets and not surfaces, how important is it to wash our hands?  (Full disclosure, I still wash my hands for 20 seconds after returning home).  What’s the science and data on the effect of masks?  I think it’s accurate to say not clear and copious.  (Full disclosure, I wear a mask when indoors and around others.)  And how about the magic 6 foot rule?  Yeah, not a lot there either, and if you’re indoors and down fan from a sick person 6 foot isn’t enough.  In most of Europe, it’s 2 meters except Nordic countries where their yardstick is 1 meter.  (Full disclosure, I still try to keep my distance from others, especially indoors).  I think they are all good guidelines, I’m not sure how scientific (as opposed to commonsense) they are.

First data analysis showed no correlation between lockdown timing and cases by state.  Now data analysis shows by and large declining transmission after state reopenings. And not just in the US, but in Europe as well.  And then comes along video from Memorial Day weekend that showed people violating all the rules.  So once again I’m asking we stop focusing exclusively on something and pull back and take a systems look.  Quit focusing on the edicts and look at people’s behavior, in its full spectrum.  Governors etc. have pretty good control over government actions, but much less over citizens behavior.  The better they understood that, the more they would try to persuade and provide data and keep current, as opposed to the current approach of rules, rules, rules that can’t help but be arbitrary whereupon you lose compliance.  What do you see in those videos at the Lake of the Ozarks?  Big signs saying stay 6 feet apart.  So how are those rules and edicts working out for you?

And the news media is not helpful, as ever since they pivoted to coronavirus is not going to happen here to a non-stop unchanging if one solitary virus so much as touches you, you’re dead.  So one half of the country is too terrified to take in new data and the other half has decided since they are still alive the virus must be gone.  

And as the data has rolled in, the picture is changing.  For instance, this virus is a lot less deadly than first thought (see https://www.cdc.gov/coronavirus/2019-ncov/hcp/planning-scenarios.html) with an overall infection fatality rate of 0.26%, not the original 3.4% WHO reported.  And the death rate is strongly correlated with age – CDC says 0.003% if under 50 (bad flu territory),  and 0.845% (or higher) if over 65.  When you look at the death statistics, basically the older you are the more likely you are to die.  Keep in mind, these are all estimates in part because there is fuzz on both number of infections and number of deaths.  I did find it interesting that when looking at the length of time in hospital, non-ICU and ICU, time on ventilator, percent that are admitted to ICU and that go on ventilation there is not a lot of variation between age groups.  So other than raw numbers, the disease looks pretty much the same  to healthcare workers regardless of patient age. 

The data on children is very encouraging, as it appears those under 25 don’t contract the disease as much, don’t transmit the disease as much, and have milder cases that result in death only with an underlying condition.  As much as it pains me, for once not only do they feel invincible, they kind of are.

So why are we not adjusting?  Shouldn’t we be less fanatic about sanitizing everything? Shouldn’t we be reopening schools, playgrounds, daycares, summer camps, etc. because the only thing you have to do to keep it safe is keep the over 25 crowd away.   Pools are safe, how many of them are open?

Hospitals have been just crushed by the lockdowns.  We issued suspension edicts because of our fear that there wouldn’t be room for all the COVID patients who never materialized, so why are we not going full open on all healthcare immediately?  Why can’t we trust hospitals, clinics, practices, etc. to manage their own affairs to take care of all the normal issues while keeping enough space, PPE, etc to cover coronavirus cases safely?  It’s one more ball in a hundred ball juggle and why we think governors are able to make a positive contribution is beyond me.

Why is the media not shouting these new numbers from the rooftops?

Why are we not letting everybody manage their own safety based on their own risk factors? Government’s default setting is one size fits all – if the government managed clothing we’d all be wearing muumuu’s.  The only way to make someone responsible is give them responsibility. 

And given how less deadly the disease is for people of working age (i.e. not significantly different than flu), and how much deadlier the disease is for older and those with certain underlying conditions, and extremely so for those in group care settings (AKA nursing homes) where at least 40% of Americans (out of 1.8% of the population) have died from COVID, we should really think about how to protect those who are at elevated risk without causing significant disruption, and increased death rates for those who aren’t.  

PS I  would add a couple of health guidelines, not just for COVID but life in general, take vitamin D and get regular exercise

Tags: