COVID Infects Speech

Spike.

That is a word I used to only hear from volleyball commentators every 4 years when I watched the Olympics. Now we can’t refer to Coronavirus cases without using that term. Apparently, cases can only spike now. Not increase, not jump, not trend upward, only spike. Gone are my data analysis days when a spike was a brief departure from the trend line that returned to trend, either up or down, because the shape of the curve resembled a spike.

You live long enough, you get to hear language change before your very ears.

When they came for the Statues, …

George Floyd is killed by a police officer in Minneapolis, and protests erupt over his death in particular and police brutality in general.  In conjunction with those protests, riots and looting break out.  When people complain about the riots and looting, they are told that they need to keep the focus on George Floyd’s death and police brutality, and the rioters and looters are not part of the protests anyway.  So while we are still discussing improvements to policing from defunding the police to voting for more Democrats in cities that have had nothing but Democratic office holders for like 50 years, the protests pivot to pulling down statues of confederate generals (Democrats to a man BTW).  When people complain about the lack of process and the destruction of property involved, they are told that if Christian churches had statues of Satan people would wonder.  I’m still wondering at that analogy.  But before the paint was dry on the first confederate statue, pretty much any old statue was fair game to be vandalized, from the alarming like abolitionist Union generals including US Grant to the simply absurd like Miguel Cervantes and Stevie Ray Vaughan.  And there are threats to the Emancipation Memorial with Abraham Lincoln which was paid for by freed slaves and dedicated by Fredrick Douglass.  So tell me again how vandalizing and pulling over statues of Abraham Lincoln isn’t taking the focus off George Floyd and police brutality?  I know I’m slow and all because when people say defund the police I somehow leap to the conclusion that means taking money from police departments but I’m assured that it means something completely different, defang perhaps.  And don’t get me started on all the white protesters calling black cops racist and that word ordinarily no white person is allowed to use. 

Another puzzling thing is how when black communities hold vigils and protests when blacks are killed by other blacks (and they do with distressing regularity) none of this nonsense happens.  It gets local media attention, no looting occurs, no rioting, no vandalizing, no violence, just peaceful protest.

I’m thinking that there are a bunch of people who really don’t care about George Floyd, his death, other people’s deaths, police brutality, racism, logic, discussion, reason, they just want to steal and break things.  An orgy of destruction is their aim.  And not only they shouldn’t be encouraged, they should be condemned.

Tags: , ,

A Unifying Moment

Today is different. Today I let someone else talk instead of me. Don’t worry, I will get back to writing indigestible tracks of prose soon. Until then, let me tease you with:

“This should be a unifying moment. No matter whom you can’t abide in American society, they’re feeling the same fear, anxiety, and uncertainty that you do. We can be angry at criminals for their crimes and simultaneously feel the need to save them from unintended and preventable deaths in their prisons. Members of the opposing political party have elderly parents and grandparents in nursing homes, too. People who voted for the other guy can get laid off or lose their businesses, too.”

Let’s Talk About Death, Shall We

I’d like to highlight a huge revision from the CDC (https://www.cdc.gov/coronavir…/…/hcp/planning-scenarios.html) to the USA case fatality ratio for COVID 19 to current estimate of 0.4% overall for symptomatic cases. Not 3.4% which was the WHO’s value from China and what we started the pandemic with. But that number hides just how significantly it changes with age. The value for people under 50 is 0.05 percent, and when you take into account that CDC estimates that 35 percent of cases are asymptomatic, you get a infection fatality rate of 0.0325% for people under 50, and if you factor in the effects of pre-existing conditions and the likelihood that younger people have a higher asymptomatic rate than older people, it’s probably less. If you are under 50 without any COVID preexisting conditions, you’re chance of dying isn’t one in a million but it is getting surprisingly close – heck, if you’re under 25 it may actually be better. 

But let’s compare that to the flu, and we will leave it at the 0.03%. Looking up values for last seasons flu numbers which CDC estimates led to 60,000 deaths in the US (and let me say it’s a very loose estimate- all values from: https://www.cdc.gov/flu/about/burden/2017-2018.htm) for the 18-49 year age bracket we have estimates of 2,803 deaths from 14,428,065 illnesses or 0.02% death rate for that age group, which is 50% higher but sure looks pretty similar especially as they are both estimates. So for the under 50 crowd COVID19 looks like a bad flu. And does anyone remember any lament in the spring of 2018 that the flu season that year had killed more Americans than the Vietnam war?

For the over 65 crowd, you have a 0.86% for the flu in 2017-2018, the number is 1.3% for symptomatic which I’m not going to adjust because at that age I’m not sure how many cases are asymptomatic which again leads to about a 50% higher death rate but at those values doesn’t look too similar. And since the over 65 crowd is estimated to have suffered 51,000 deaths out of the estimated 61,000 that season, you can see how the seniors not only drive the flu numbers but drive the COVID numbers even more. 

Did you know that if you are under 50 your chance of dying from an accident as you go about your daily life is higher than of dying from COVID if you catch it?

If you’re really feeling cheery, dive into the Deaths and Mortality (2017 is the latest) statistics with me (https://www.cdc.gov/nchs/fastats/deaths.htm) where you can see that at 100,000 deaths COVID has passed up flu/pneumonia (55,700 deaths) and diabetes (83,500) – although since diabetes is considered one of those death enhancing preconditions for COVID, which one gets credit if someone dies with both diabetes and COVID – and is closing in on Alzheimers (121,400). Then comes stroke (146,300), chronic lower respiratory disease (160,200 – and same question as diabetes), accidents (169,900) and then the two biggies – cancer (599,100) and heart disease (647,500). I’m hoping COVID doesn’t make it past Alzheimers. When you add it all up, the average death rate for all causes for all Americans in 2018 was 0.87%.

So while on the one hand it’s kind of amazing that COVID can come out of nowhere and become the seventh leading cause of death in roughly 3 months, on the other hand all those others kill people year in and year out without much fanfare from the media or concern on our part.

Tags:

Why Are We Not Adapting to New Data?

All the politicians and bureaucrats who are making the rules we live by these days always invoke science and data as the ultimate arbiter for all the rules.   You would be hard pressed to find a bigger fan of science and data than me, and less of a fan of politicians and bureaucrats.  So now that CDC says transmission is primarily through respiratory droplets and not surfaces, how important is it to wash our hands?  (Full disclosure, I still wash my hands for 20 seconds after returning home).  What’s the science and data on the effect of masks?  I think it’s accurate to say not clear and copious.  (Full disclosure, I wear a mask when indoors and around others.)  And how about the magic 6 foot rule?  Yeah, not a lot there either, and if you’re indoors and down fan from a sick person 6 foot isn’t enough.  In most of Europe, it’s 2 meters except Nordic countries where their yardstick is 1 meter.  (Full disclosure, I still try to keep my distance from others, especially indoors).  I think they are all good guidelines, I’m not sure how scientific (as opposed to commonsense) they are.

First data analysis showed no correlation between lockdown timing and cases by state.  Now data analysis shows by and large declining transmission after state reopenings. And not just in the US, but in Europe as well.  And then comes along video from Memorial Day weekend that showed people violating all the rules.  So once again I’m asking we stop focusing exclusively on something and pull back and take a systems look.  Quit focusing on the edicts and look at people’s behavior, in its full spectrum.  Governors etc. have pretty good control over government actions, but much less over citizens behavior.  The better they understood that, the more they would try to persuade and provide data and keep current, as opposed to the current approach of rules, rules, rules that can’t help but be arbitrary whereupon you lose compliance.  What do you see in those videos at the Lake of the Ozarks?  Big signs saying stay 6 feet apart.  So how are those rules and edicts working out for you?

And the news media is not helpful, as ever since they pivoted to coronavirus is not going to happen here to a non-stop unchanging if one solitary virus so much as touches you, you’re dead.  So one half of the country is too terrified to take in new data and the other half has decided since they are still alive the virus must be gone.  

And as the data has rolled in, the picture is changing.  For instance, this virus is a lot less deadly than first thought (see https://www.cdc.gov/coronavirus/2019-ncov/hcp/planning-scenarios.html) with an overall infection fatality rate of 0.26%, not the original 3.4% WHO reported.  And the death rate is strongly correlated with age – CDC says 0.003% if under 50 (bad flu territory),  and 0.845% (or higher) if over 65.  When you look at the death statistics, basically the older you are the more likely you are to die.  Keep in mind, these are all estimates in part because there is fuzz on both number of infections and number of deaths.  I did find it interesting that when looking at the length of time in hospital, non-ICU and ICU, time on ventilator, percent that are admitted to ICU and that go on ventilation there is not a lot of variation between age groups.  So other than raw numbers, the disease looks pretty much the same  to healthcare workers regardless of patient age. 

The data on children is very encouraging, as it appears those under 25 don’t contract the disease as much, don’t transmit the disease as much, and have milder cases that result in death only with an underlying condition.  As much as it pains me, for once not only do they feel invincible, they kind of are.

So why are we not adjusting?  Shouldn’t we be less fanatic about sanitizing everything? Shouldn’t we be reopening schools, playgrounds, daycares, summer camps, etc. because the only thing you have to do to keep it safe is keep the over 25 crowd away.   Pools are safe, how many of them are open?

Hospitals have been just crushed by the lockdowns.  We issued suspension edicts because of our fear that there wouldn’t be room for all the COVID patients who never materialized, so why are we not going full open on all healthcare immediately?  Why can’t we trust hospitals, clinics, practices, etc. to manage their own affairs to take care of all the normal issues while keeping enough space, PPE, etc to cover coronavirus cases safely?  It’s one more ball in a hundred ball juggle and why we think governors are able to make a positive contribution is beyond me.

Why is the media not shouting these new numbers from the rooftops?

Why are we not letting everybody manage their own safety based on their own risk factors? Government’s default setting is one size fits all – if the government managed clothing we’d all be wearing muumuu’s.  The only way to make someone responsible is give them responsibility. 

And given how less deadly the disease is for people of working age (i.e. not significantly different than flu), and how much deadlier the disease is for older and those with certain underlying conditions, and extremely so for those in group care settings (AKA nursing homes) where at least 40% of Americans (out of 1.8% of the population) have died from COVID, we should really think about how to protect those who are at elevated risk without causing significant disruption, and increased death rates for those who aren’t.  

PS I  would add a couple of health guidelines, not just for COVID but life in general, take vitamin D and get regular exercise

Tags:

You Can Tell Them Apart by the Mask

Funny how masks became another way we divide ourselves into two opposing tribes. The science and data for the effectiveness of cloth masks on lowering your transmission or susceptibility to viruses, let alone the Wuhan virus, is inconclusive, so I suppose it lets us argue while each side can claim the mantle of science and data. What would be really nice is if we could get some elegant experiments soon enough to guide us.

I come down firmly on the side of I don’t know, I don’t see how it hurts, so I wear a mask indoors but not outdoors. But if I don’t happen to have one and I need to go indoors, I don’t sweat it. Basically, my value proposition is the cost is low and the benefit is unknown but probably there. Full confession, I have a couple of old N95 dust masks so those are the ones I usually wear and I do think their benefit is likely and large despite age and use. So yeah, I cheat.

I do find a few things interesting about the tribes. Back at the start of this, when the recommendation was don’t wear a mask because it doesn’t help and you are depriving heroes from theirs, it was the compliant kids who were all about not wearing the mask while the rebels were all about asking why not – pointing out that people always wore masks in prior pandemics and that asian countries which were doing well against the virus all wore masks and then one day the experts said, hang on, asymptotic spreading changes everything and the whole world flipped upside down on masks. Masks don’t stop you from catching the disease, they stop you from spreading it (no word on what all those medical personnel wearing masks felt about this turn of events). Now the compliant kids are all about wearing the masks, urging others to wear a mask for the sake of their fellow man, not themselves, and the rebels are all like how did cloth become one way so that it lets the virus in my mask but doesn’t let it out of your mask and there’s no data while forgetting about all those reasons to wear one they pointed to before the experts said wear a mask. Strange.

I get the effect of the Trump distortion field on Hydroxychloroquine which means once again we divide up into tribes based on how we feel about Trump. But if you think a medicine is effective or not, or hope it’s proven to be effective or not based upon how you feel about a particular politician, you really should have your head examined. It’s almost enough to make me despair for humanity. The only sane, human, reasonable, caring position is that you hope Hydroxychloroquine is effective against COVID19 (but only rigorous efficacy trials can prove it) so that we have an effective treatment and many lives are saved and much suffering is reduced or averted. I would have preferred that gargling with hot water was effective as a whacked out viral video claimed way back in late February even though that meant that some crazy quack was right because look at how many lives would have been saved and how much suffering would have been averted if only it were true.

When the facts change, I change my mind.

Tags:

A Better Way to Act on COVID19


We are all in this together, but we are all not the same. The risk of death or serious illness varies quite widely from one person to the next by a factor of like a thousand based on age and certain conditions like diabetes, and our life situations also vary quite widely. For example, my wife and I no longer have parents to take care of (or worry about), while many other married couple our age do have elderly parents. So basing all our actions and policies on some perceived worst case just doesn’t make sense.

I really think we are continuing to make certain mistakes because we are not adjusting to data as it becomes available, and because of the emphasis on statewide common actions. We are citizens, not subjects; we are adults, not children. So the “because I say so” from governors and other politicians, or the “we are all going to die” from my fellow citizens is wearing thin. Why are we not following the American way? By all means, make recommendations, but don’t just issue edicts and claim they are data driven. Provide the data, provide the rationale and inferences, take into account important differences, and let us make informed decisions on the risk we are willing, or unwilling as the case may be, to assume.

Phone data shows people began social distancing and staying at home before any politician issued an edict. We don’t need nannies or nags, we need information and reasoned discussion. Treat us like a adults, and we’ll act like the adults we are. Don’t treat us like children and then be surprised when some act petulantly.

This is a very serious and deadly disease, which means we should tackle it with our best practices which are open and honest communication, frank discussion of options, data, and uncertainty, and the appreciation that while we are all equal we are not all the same and so not only can reasonable people disagree, the correct course of action will be different for people in different situations. The best way to find our way through this challenging and uncertain time is through people doing what they think best and constantly reassessing as data rolls in. And that includes people trying different things and seeing what happens. COVID 19 did not change everything, and we need to stop thinking and acting like it did.

Testing, Testing, Testing

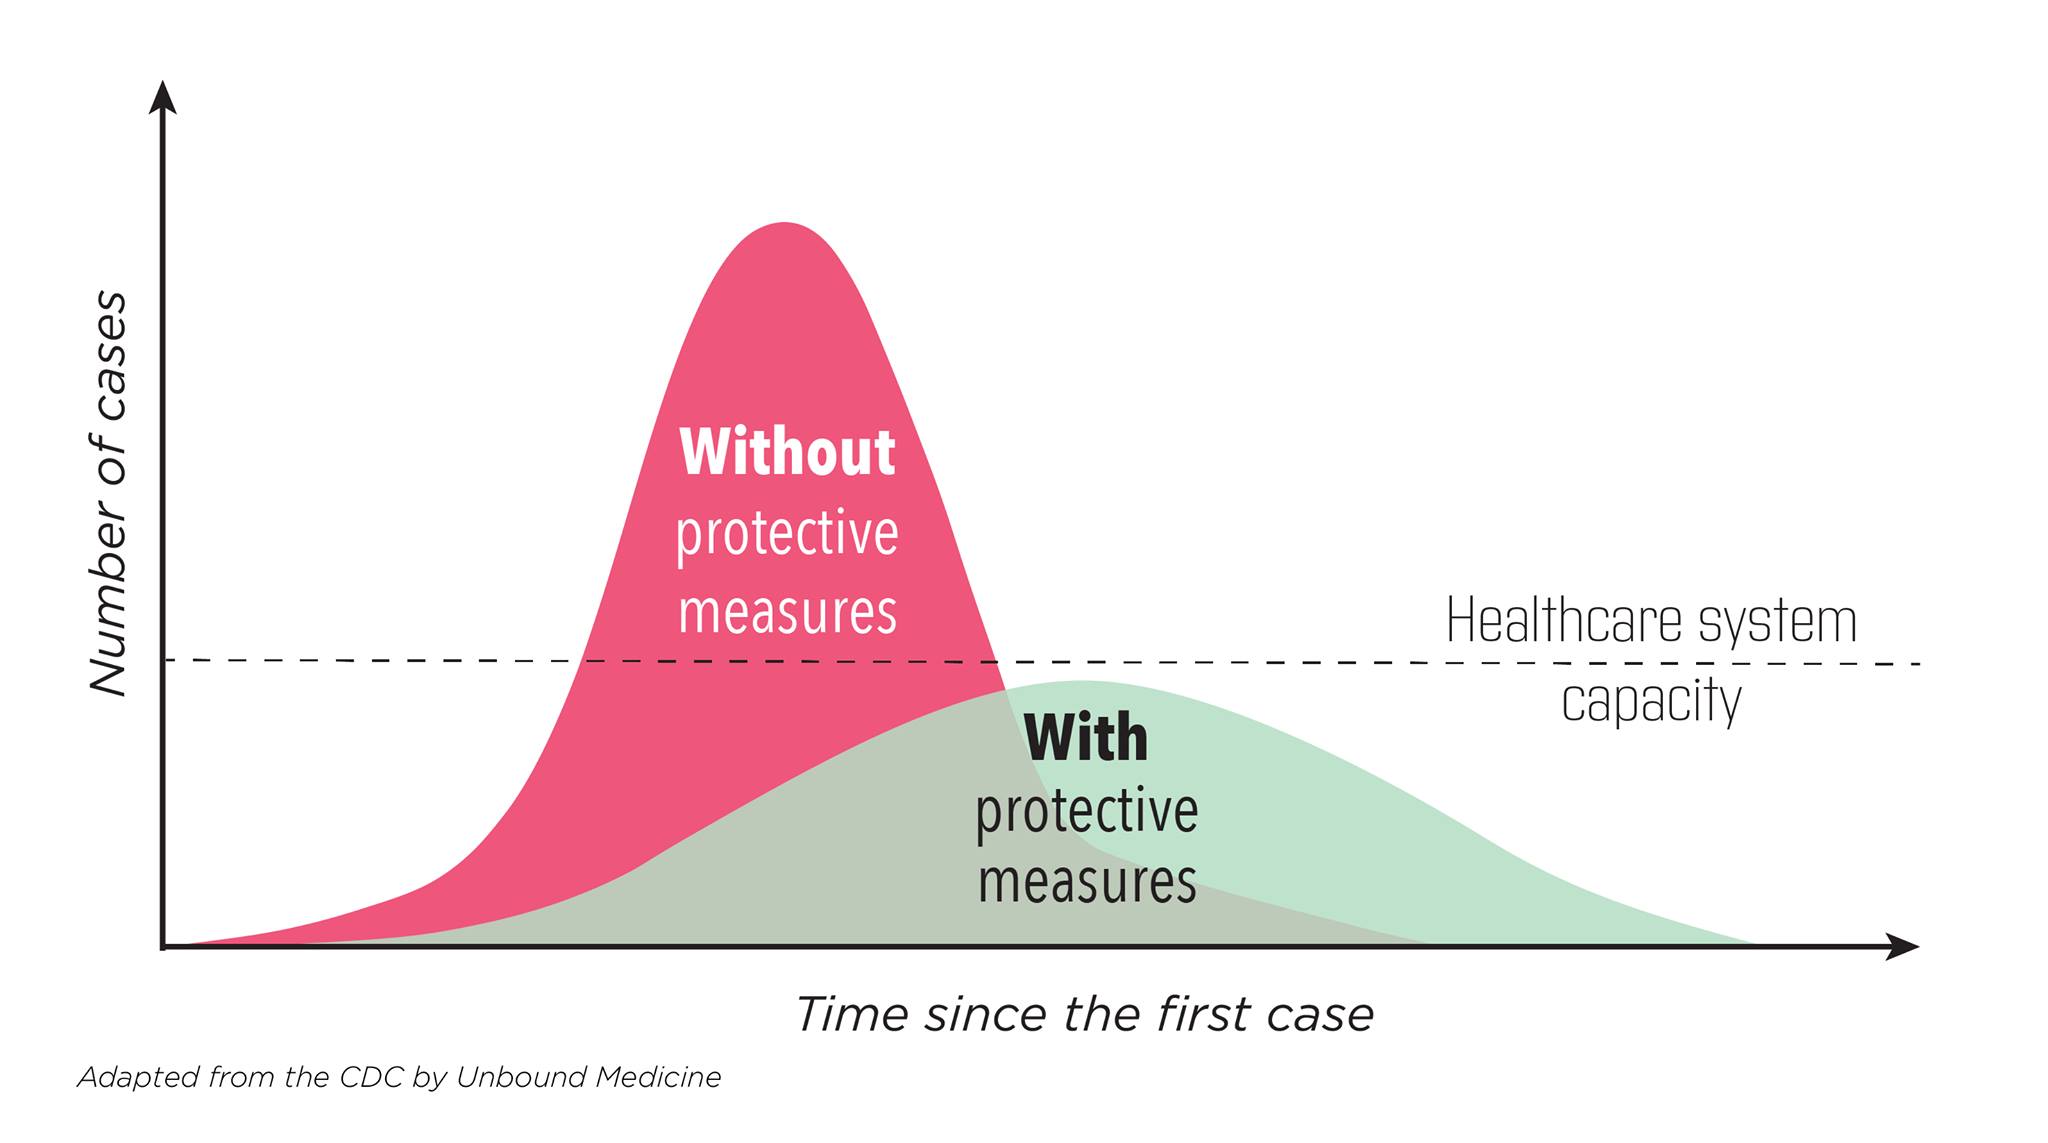
Let’s talk numbers. I know what you’re thinking, I was promised no math. So no equations, just a couple of pretty pictures and a lot of words. I trust we’ve all seen the first chart – we know it, we love, we live it. 

Let’s be honest, it isn’t accurate, it’s idealized. 

The first thing I’ll note, is if the only thing that changes is that as time goes on more people become immune, the right side is not symmetrical with the left side, in fact the drop off is faster than the rise and that is because during the rise the rate of change in available infectees is less than during the descent because there are fewer available infectees. And yes, I created an Excel model and discovered this. 

The second thing, is that for this epidemic at least, you don’t start with protective measures (you know, the guidelines) in place, so the reality is there is this transition period as people react, and in the case of COVID in advance of any orders to, so there would be this period of lowering the transmission as behavior changed that would put you on a different slope.

The third thing is, people are people. And that means we have this tendency to adjust to risks so as we see the curve flattening (and thus the risk lowering), we would engage in riskier behavior, and as we see the curve steepening, we would engage in less risky behavior. Don’t believe me? Look at the history of automobile safety, where every safety advance is met with an increase in risky behavior such that deaths per mile decline less than what the safety feature should cause. 

So put that all together, and you have the actual reality of new cases just won’t ever look like those nice curves (oops, did I forget to mention random noise, so unsmooth the curves!) It will start steep, then flatten, but won’t ever go all the way down like you think it ought to. And there may well be multiple upticks depending on how long until either a vaccine or herd immunity kicks in.

I will just note at this point the area under the curves are not the same – the one that has lower transmission rates will have less area, i.e. fewer people will get infected. (Thanks again, Excel model). But since these are idealized, and the reality is messy and complicated, yeah, all bets are off on which one infects fewer people.

And that’s the real curve of actual new infections. Now let’s talk about the measured version. It isn’t the actual number, it’s a sample of the actual number.

So it’s going to have more noise (go to Worldometer, look at the new daily death histogram for the USA and explain to me why it varies 100% over a six day period – don’t worry, I’ll wait). 

And it’s going to depend on how many tests we run a day. More tests mean more new cases measured. If the actual number were flat, if you ran more tests you would see an increase in the number of cases. As I always said about software bugs, the sooner we stop testing the sooner we’ll stop finding problems. Normally we take care of that by normalizing, i.e. dividing the number that allows you to make meaningful comparisons like total number of people in a state to compare states or total number of tests (which is why I think Dr. Birx, whom I admire and respect, was always quoting the percent positive rates on tests as well as the totals). 

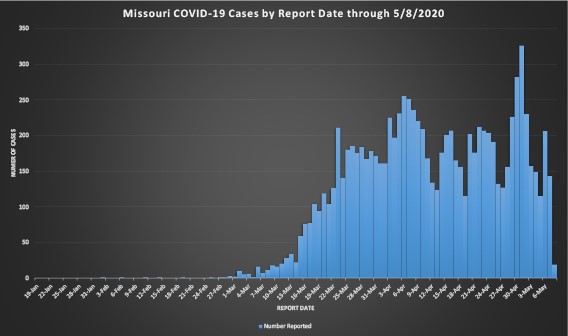
Now normalizing works well if you are consistent in your test criteria, e.g. people who have symptoms bad enough they are willing to have a swab shoved far, far up their noses (in the old days, till it came out the back). And test type. What happens when you starting with one test done by hand in state labs, and then keep adding different tests run on different equipment and you switch from shoving the swab 4 inches up someone’s nose to 2 inches? Do they all have the same sensitivity and error rates? But wait, that not the only changes you make, what happens when you keep increasing your testing to the point where you test everybody in a meat packing plant even though no one asked to have a swab shoved up their nose? IOW, you test both asymptomatic as well as symptomatic? You see another round of big jumps, like where Missouri found 373 workers were infected but asymptomatic. And at the same time you’re looking at new cases chart like the one I included, the State of Missouri is moving the date of the case from the test to when the person reports the first symptoms occurred.

So look at that chart and tell me are cases increasing, declining, or treading water. And while you’re at it, try to come up with a way to normalize across all those changes in testing. I don’t know about you, but when I try to look at that real chart and compare it to the idealized chart, I wonder how one can possibly relate to the other, and I’m vary comfortable with data, noise, uncertainty, and models vs. reality.

So I will say that Missouri, and I think every state at the request of the Federal government, provides a deeper dive into the data: 

https://health.mo.gov/…/novel-coro…/pdf/analytics-update.pdf

where they do cover many things, including COVID hospitalizations and percent positive test results (smoothed to a seven day average, which given that’s a work week seems right to me at the risk of loosing sight of short term trends) which shows a peak back on 3/21 at over 20% with a decline, a long plateau, and another decline to ~4% on May 2. I don’t know about you, but that makes me feel better, like the rate of infections really are declining.

So what does it all mean? I think we are getting better, but don’t expect the simple one wave if you do it right, two waves if you do it wrong concept, and don’t even get me started on why the second wave will by necessity be worse than the first. 

Now here’s another quick, back of the envelope calculation – chart shows about 200 new cases a day, say that represents worst case 10% of real infection rate so 2000 new cases a day, and given a population of 6,138,000 (I rounded up from wikipedia 2019 figure), it will take another 3,069 days before we all catch it here in Missouri, wait, subtract 30 days for what we’ve already gone through, so over eight years. I think we’ll have a vaccine by then. If you don’t like my calculations, get your own envelope.

And I think we should start calming down.

Tags:

A Better Way to Think About COVID19


I’ve come to the conclusion we are not thinking rationally about the COVID 19 pandemic. The problems are in large part driven by its novelty which leaves us vulnerable to our cognitive biases. First we have tunnel vision (AKA Cognitive Tunneling combined with Zero Risk Bias) and basically have focused on COVID 19 to the exclusion of all other considerations. This means we are looking at the results of the virus to consider every death from COVID 19 as a loss but ignore every other death, and infection from COVID 19 as a loss but ignore all other health and non-health problems. And loss aversion means we can’t take our focus off COVID, we only see the risks associated with COVID 19 infections and fatalities and are blind to all other risks. Essentially the enormous uncertainty and newness so terrified us that we pulled the covers over our head and refused to get out of bed. That’s OK for a day or two, but if we all do that how long can we keep it up?

So my suggestion is to lose the exclusive focus on COVID since it leads to a terrible local optimization problem where we are only optimizing for COVID and nothing else. Clearly COVID is a serious disease, but it isn’t the only serious disease we face. Instead, we should recognize the loss from COVID without action and count every decrement from that as gain – because we can think much more rationally about gains and in large part that’s how we think about all other disease and causes of death. 

So what does that mean? Let’s take that initial estimate of 2 million deaths in the US over the next two years (approximately) and use as our benchmark the 2.8 million non-COVID deaths (just to put an anchor out there, the case fatality rate for a year of life in the US is 0.86%) plus the 1 million COVID deaths per year and then strive to drive the number down from 3.8 million per year. And this is realistically the situation we confront. Since COVID would be the leading cause of death in this framing, clearly efforts should be significantly but not exclusively focused there as it would be only somewhat ahead of heart disease at over 647,000 and cancer at 599,000 deaths per year. This framing allows us to take a holistic system approach to the problem and we need our metrics to reflect that. The constant drumbeat from the media showing the daily death count from COVID alone doesn’t help us, it hurts us.

You may ask how is our current framing is hurting us. Keep in mind that the general rule of thumb (Pareto Principle) is that the first 80 percent of a solution is cheap and easy and the remaining 20 percent is increasingly expensive and difficult. In our zeal to drive one risk to 0, we are paying the full expense of getting to a complete solution for one problem (COVID) while starving all others of resources and attention – and in terms of fatalities those problems cause more deaths. If we don’t look at the full picture, we will be worse off and won’t make the right trade offs. Adult life is tradeoffs. We need to pull the covers down and get back to living.

Death statistics can be found at: https://www.cdc.gov/nchs/fastats/deaths.htm

Tags:

I looked up and there it was

Here’s something you don’t see everyday: The shadow of a contrail on the clouds below. What an amazing world we live in!